1. a. Y = c0 + c1 (Y = T0) + e0
- e1 i + G0
Y - c1 Y = c0 - c1 Y + e0
- e1 i + G0
(1 - c1) Y = c0 - c1 Y + e0
- e1 i + G0
IS Curve => Y = 1/(1 - c1) [c0 - c1 T + e0 + G0] - e1/(1 - c1) i
b. Shifting i to the left-hand side of the IS curve yields:
i = 1/e1 [c0 - c1 T + e0
+ G0] - (1 - c1)/e1 Y
The slope of the IS curve D i/D
Y = -(1 - c1)/e1
2. a. Given the expression for the IS curve in part b we can see that a positive D G will cause the intercept of the IS curve to shift, but there will be no change in the slope. Also, the expression for the IS curve in part a allows us to say that the horizontal shift in the IS curve (i.e. the shift in the IS curve at every interest rate) will be given by:
1/(1 - c1) D G, the multiplier times the change in G. This tells us that the multiplier times a change in autonomous spending gives the horizontal shift in the IS curve.
b. Given the expression for the IS curve in part b we can see that a positive D c1 (the marginal propensity to consume) would cause the slope to become a smaller negative number (i.e. (1 - c1)/e1 would be smaller in absolute value). This would cause the IS curve to be flatter in the i,Y plane. Put another way there would be a smaller D i for a given D Y. Also, because of the fact that taxes affect spending through the marginal propensity to consume, the intercept of the IS curve would decrease given a positive D c1. The most important thing this tells us that the bigger the multiplier the flatter the IS curve.
c. Given the expression for the IS curve in part b we can see that a positive D e1 (the interest sensitivity of investment spending) would change both the slope and intercept of the IS curve. The slope would be become a smaller negative number, and the graph of the IS curve would become flatter, just as in part b. The intercept would become smaller. The most important result this gives us is that the more interest sensitive is investment spending the flatter will be the IS curve.
3. a. The constants h1 and h2 are called the income
sensitivity of money demand and the interest sensitivity of money demand,
respectively.
b. (M/P)0 = h0 + h1 Y - h2
i
h2 i = h0 + h1 Y - (M/P)0
LM Curve => i = 1/h2 (h0 - (M/P)0] + h1/h2 Y
c. The slope is h1/h2. The intercept is 1/h2
(h0 - (M/P)0].
4. a. Given a positive D (M/P)0
the slope of the LM curve is unchanged. The intercept declines (in the
i,Y plane the curve shifts down).
b. Given a positive D h1 (an
increase in the income sensitivity of money demand) the LM curve will become
steeper. The slope is h1/h2 which becomes bigger,
meaning that for a given change in Y there will be a bigger change in i.
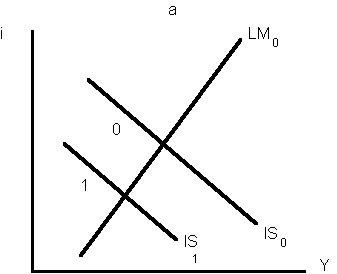
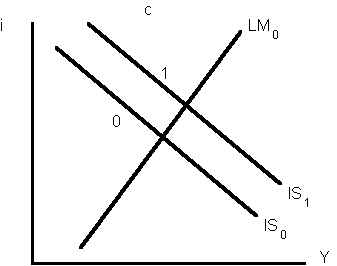
5. Figures a through c give the results:

6. This statement is False. The fact that the economy can reach many positions on a given LM curve demonstrates this. A given LM curve is derived holding the money supply constant. As long as there are many incomes along an LM curve, the ratio of money supply to income must vary. [Note: if h2 was zero, i.e. there was no income sensitivity of money demand, then there would only be one income associated with any given money supply, and the statement would be true - try to figure out why this is so.]
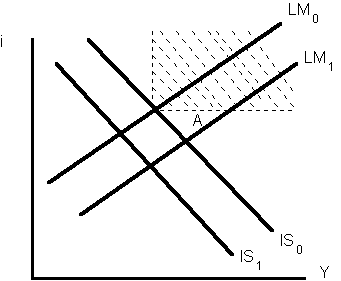
7. Figure 2 is useful for this answer. Note that the shaded area gives the area in which the new IS-LM intersection must take place (it was given that there was an increase in interest rates and an increase in income.) The increase in taxes would shift the IS curve to IS1 and the increase in the money supply would shift the LM curve to LM1. The intersection of IS1 and LM1 is out of the shaded region. To get the new IS-LM intersection into the shaded region, government expenditures would have had to increase substantially (enough to shift the IS curve so that it intersects LM1 higher than point A.
8. Assuming that there was a decrease in the demand for money, the LM curve would shift down, and there would be an increase in income and decrease in interest rates. (To see this consider what would happen if h0 in the model given in problem 3 declined - this would reduce the intercept of the LM curve.)
9. The answer is: nothing happens to the money supply. One might ask why. Well, the money which individuals pay the government in taxes is, for an instant, taken out of the money supply (remember that the money supply is the currency and checking accounts of the nonbanking private sector - the government's checking account does not count). However, given the government debt, either this money instantly goes back into circulation as the government makes an expenditure (or transfer payment) or pays off the holder of a government bond - there is no way for the government to keep the money.
10. Figure 3 gives the answer to this question. The important assumption is that interest rates adjust much more rapidly than does income.